Images of Sun as of today
Below are the present-day Sun photographs taken by NASA's Observatory of solar dynamics (NASA Solar Data Analysis Center).
Special equipment (AIA) allows you to receive images of the solar atmosphere on ten allocated frequencies, whereas the image spans about 130% of the solar diameter. Such visibility allows us to study the coronary emissions.
Special processing and analysis of the data obtained in such a way allows not only to track changes, but also to predict the processes successfully that occur in the Sun atmosphere, which are caused by variation in solar activity. For example, a change in the topology of the magnetic field is associated with temperature changes in coronal plasma, and helioseismology and convective processes are associated with the temperature distribution and others.
Click on the picture to watch in a larger scale.
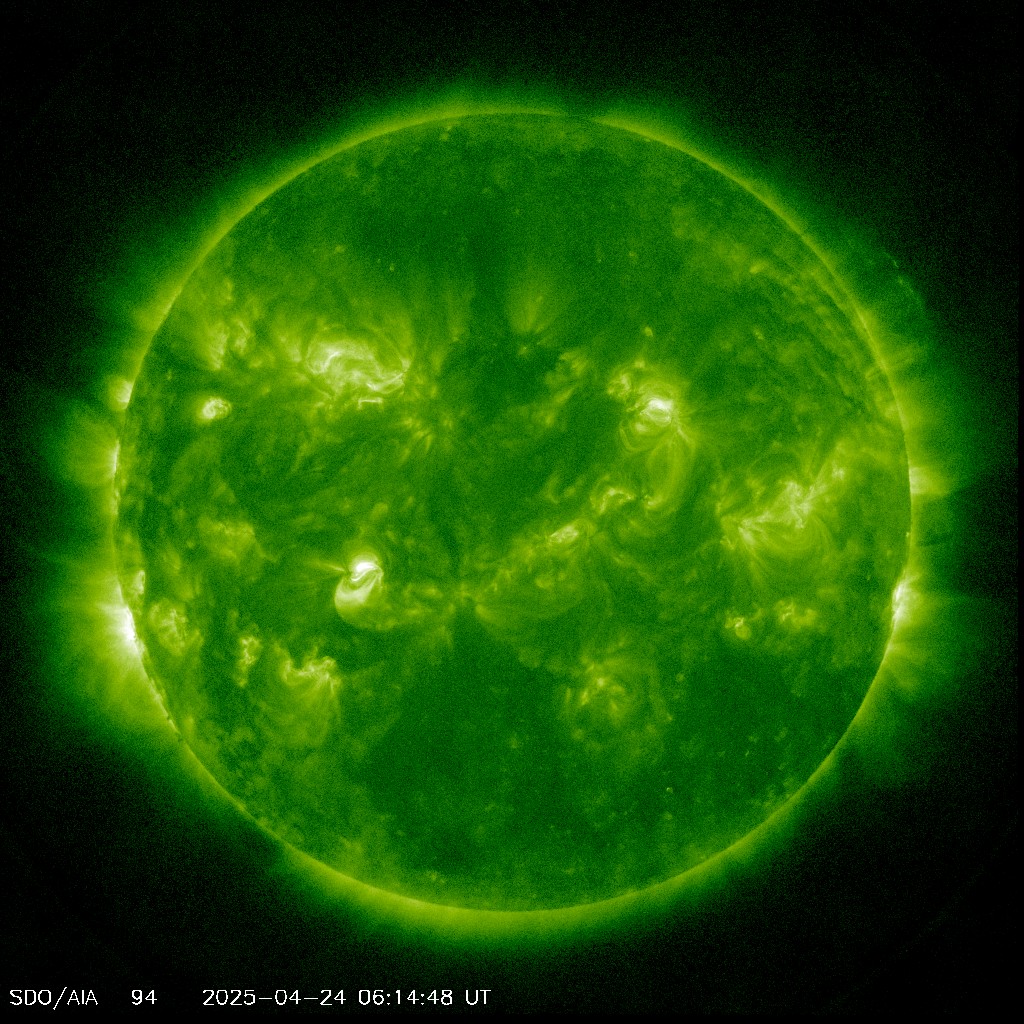
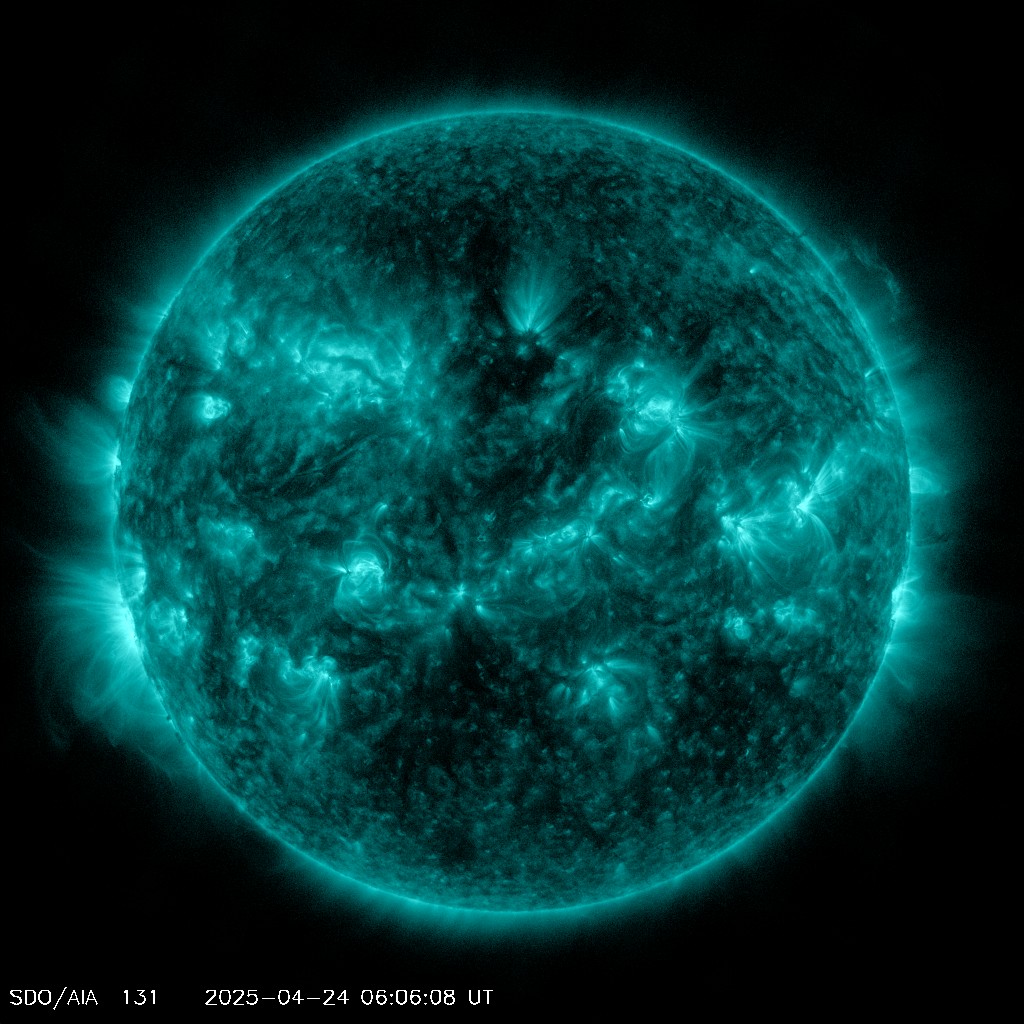

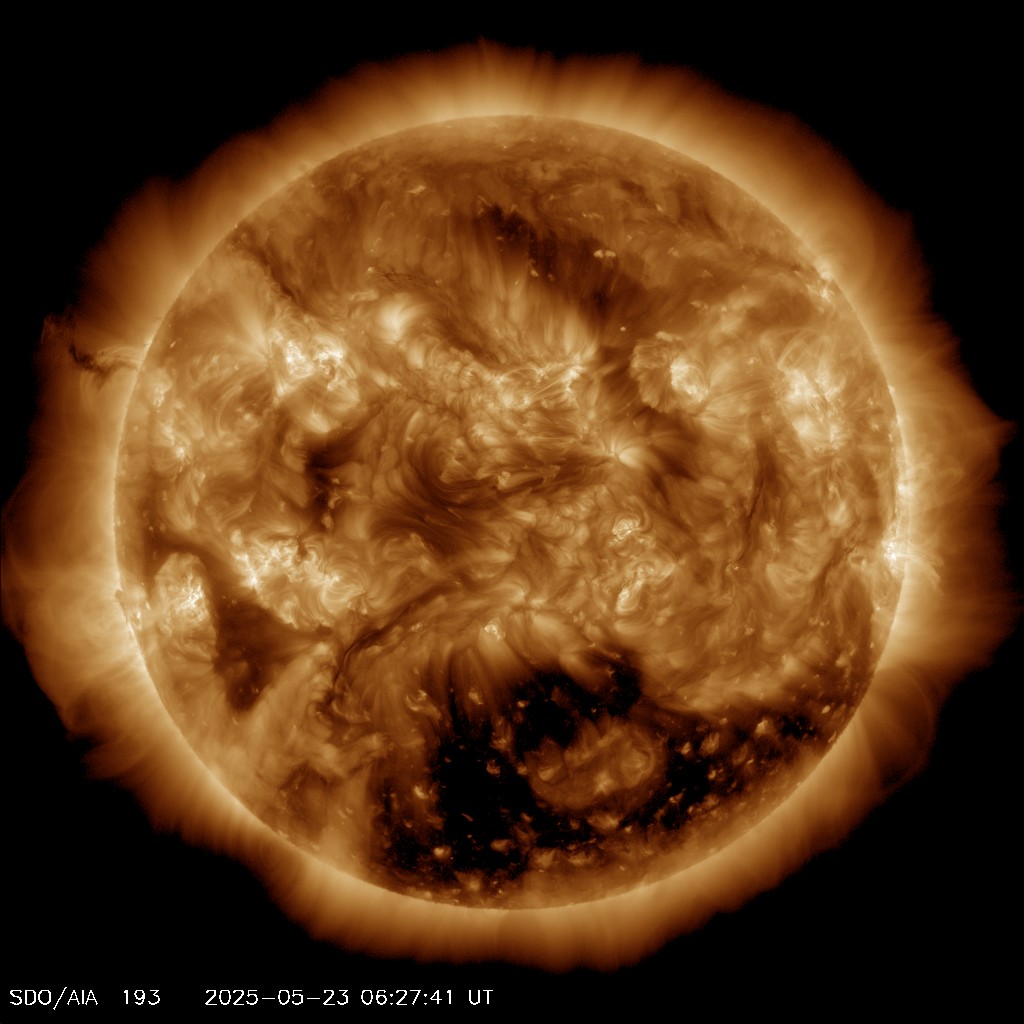
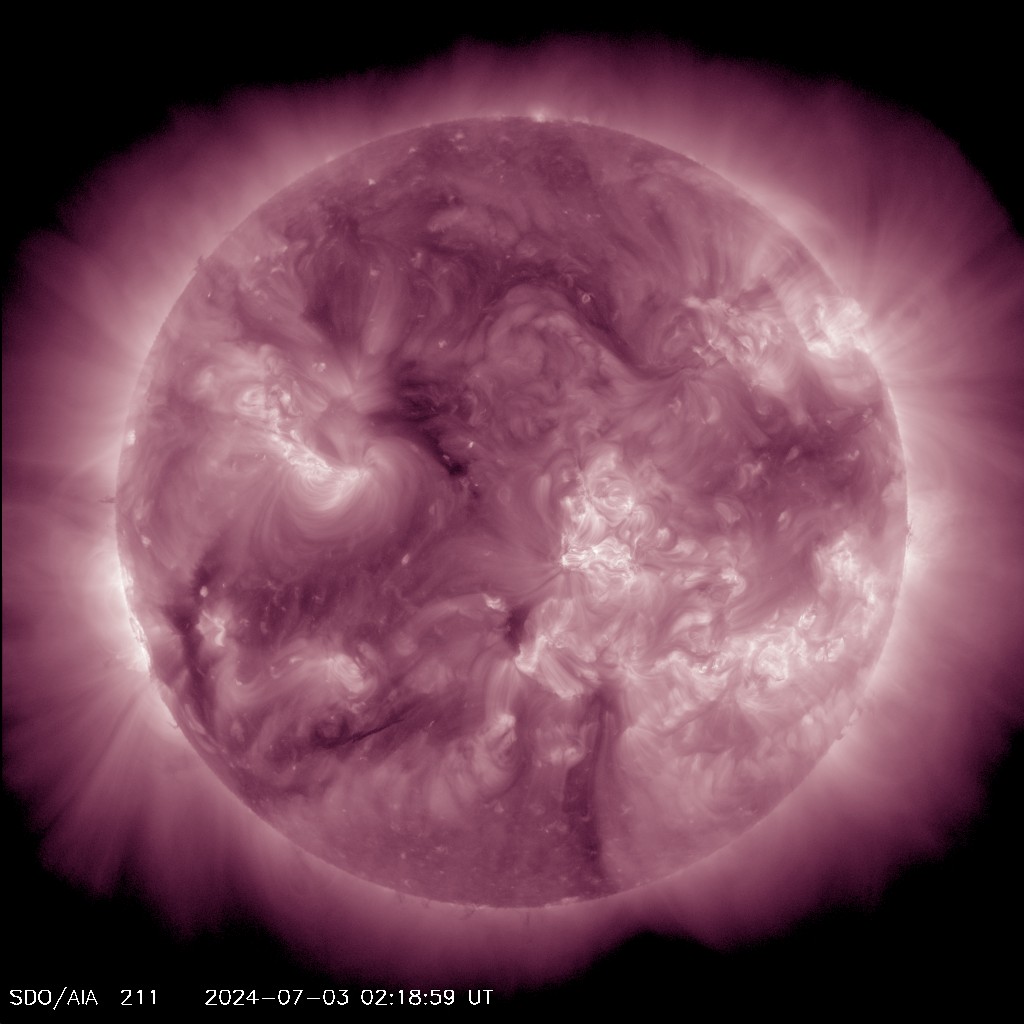
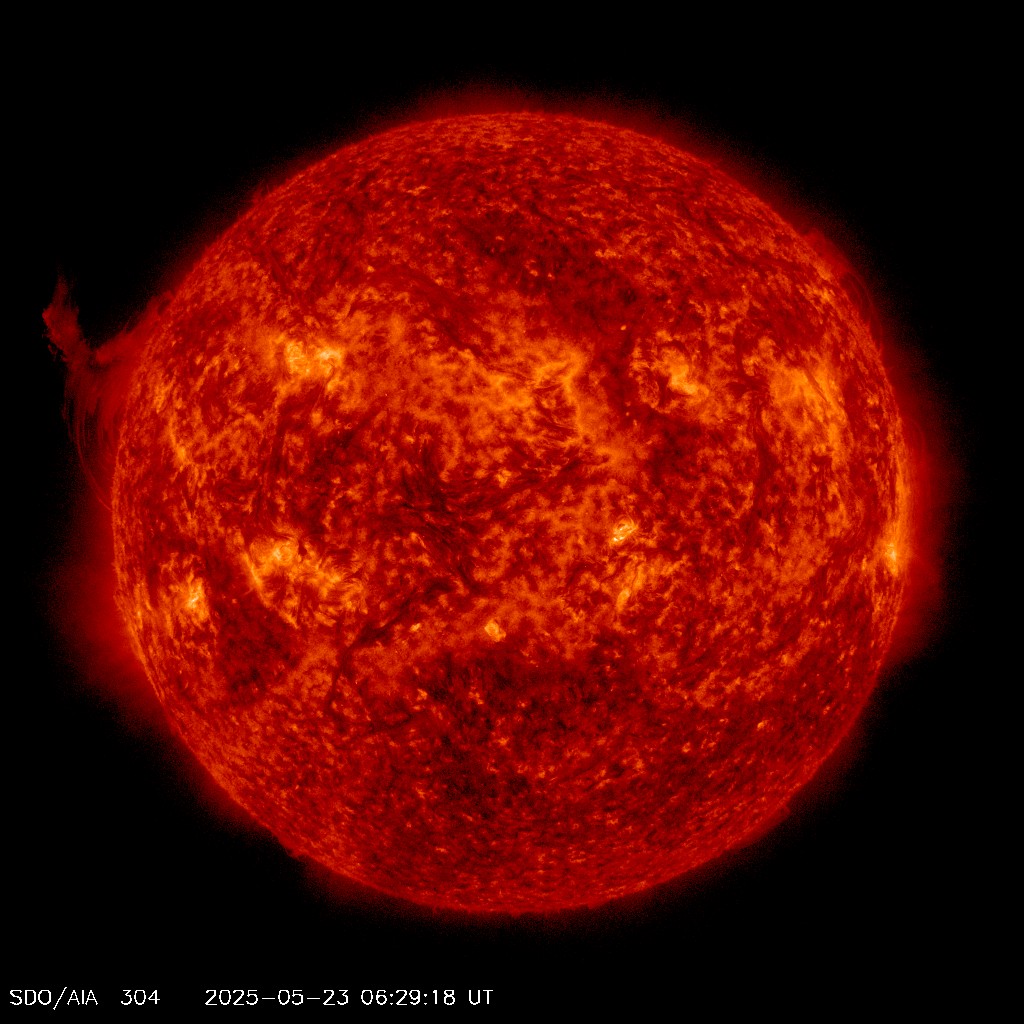
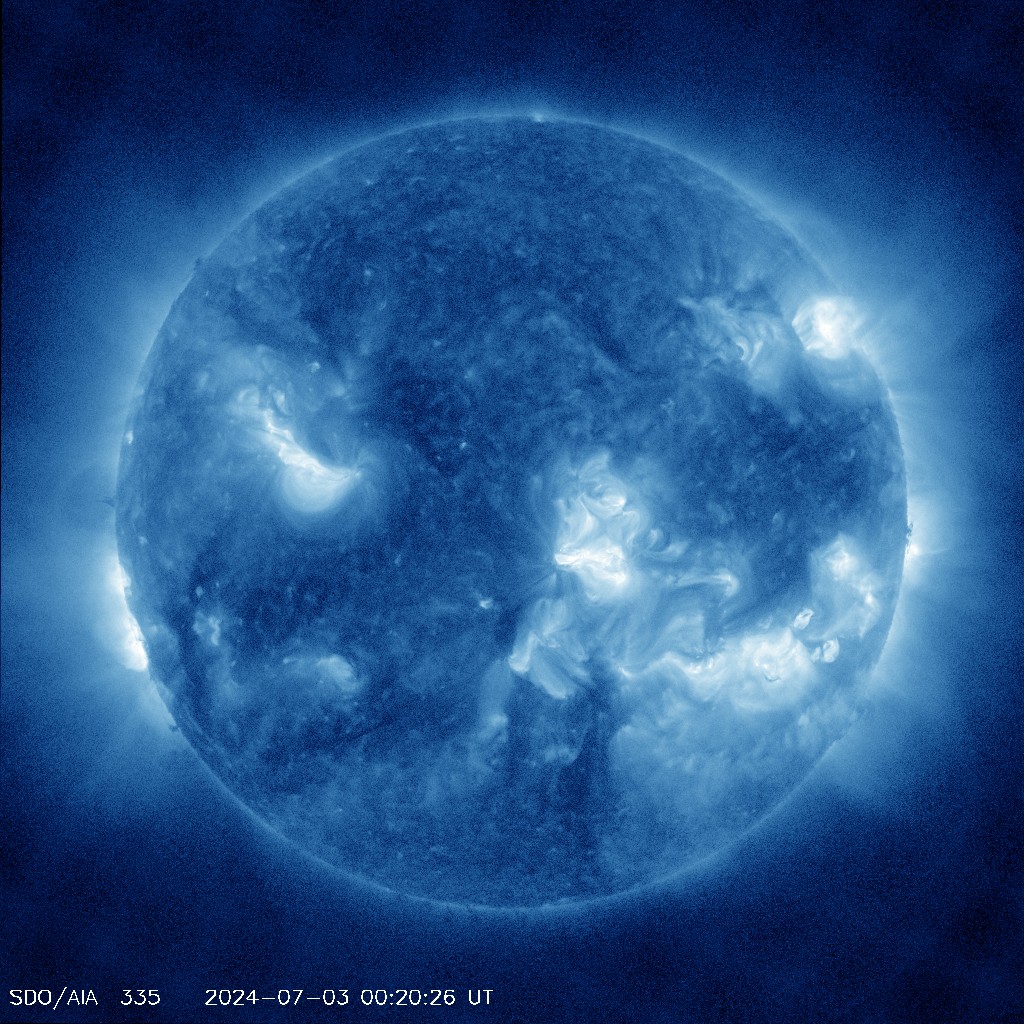
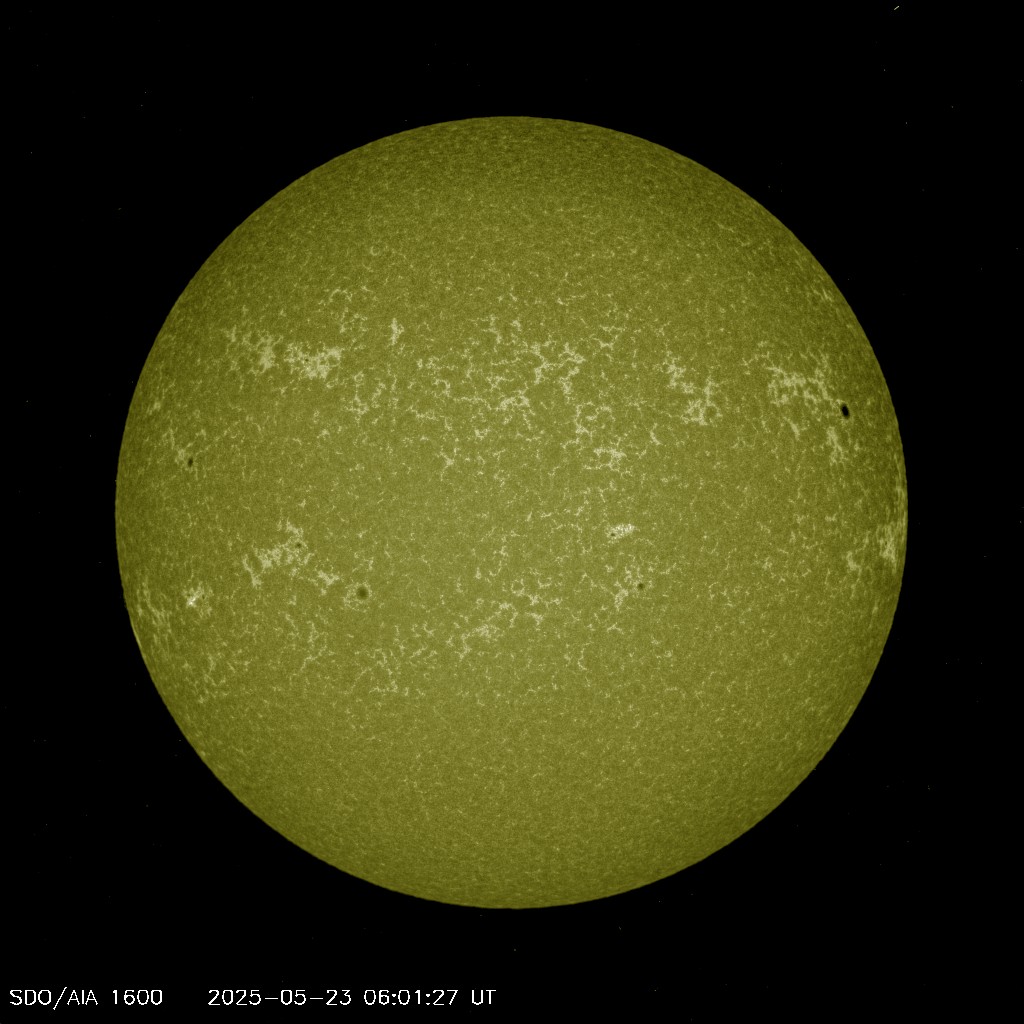
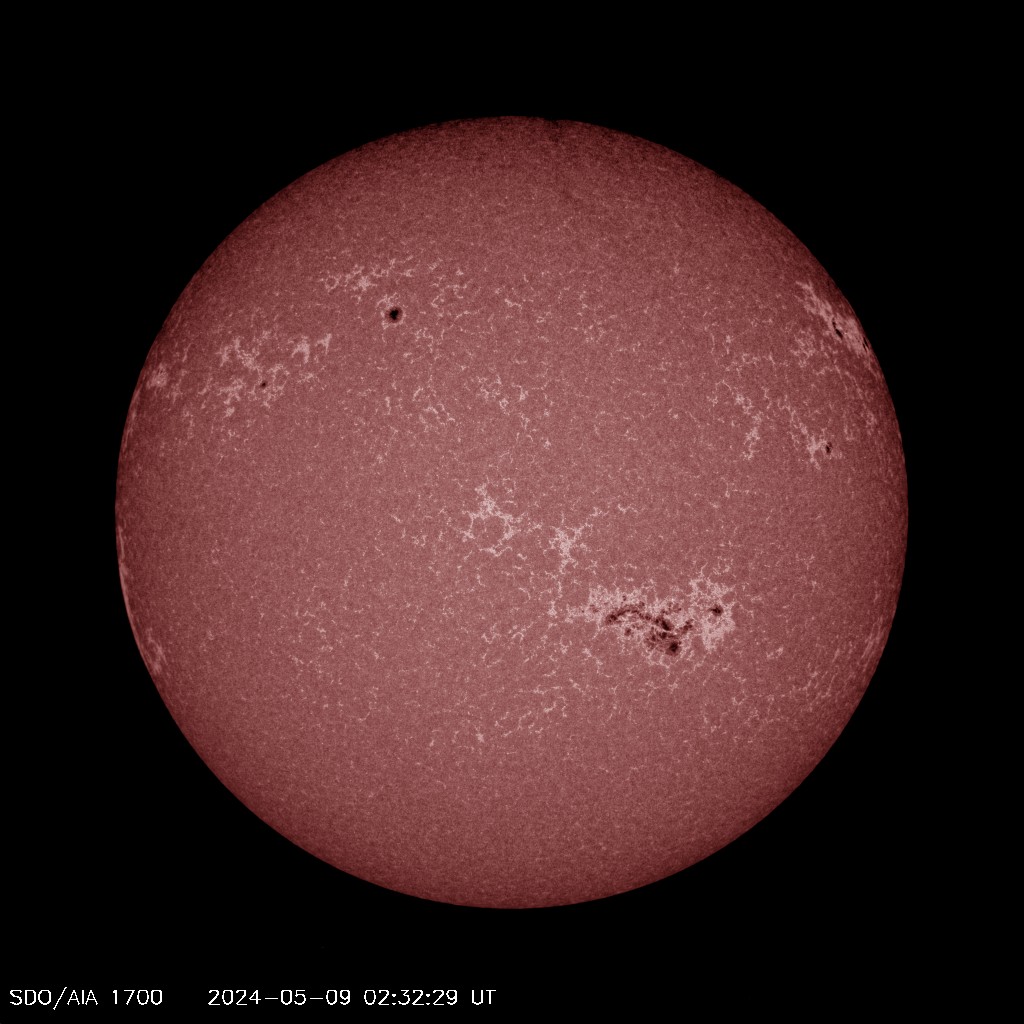
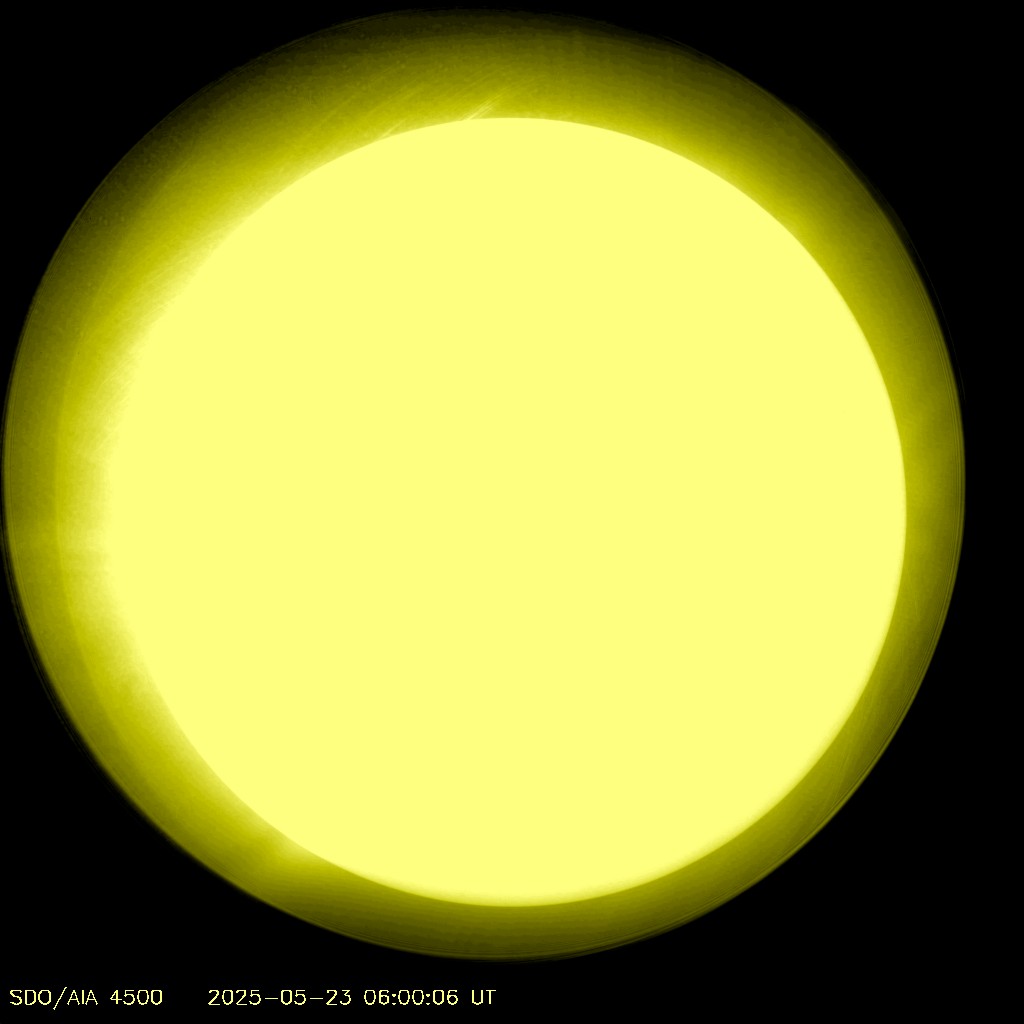
Table 1 - Spectral correspondence of AIA SDO data.
| Channel Name AIA | The region of the Sun atmosphere | Primary ions | The logarithm of the temperature T° K, lg(T) |
|---|---|---|---|
| Visible color | Photosphere | Totality | 3.7 |
| 1700 Å | Temperature minimum of the photosphere | Totality | 3.7 |
| 304 Å | Chromosphere, a transition region | He II | 4.7 |
| 1600 Å | Transition region + upper photosphere | C IV+cont. | 5.0 |
| 171 Å | Quiet corona, top of the transition region | Fe IX | 5.8 |
| 193 Å | Corona and hot coronal emissions | Fe XII, XXIV | 6.1, 7.3 |
| 211 Å | Active regions of the corona | Fe XIV | 6.3 |
| 335 Å | Active regions of the corona | Fe XVI | 6.4 |
| 94 Å | Fields of flares | Fe XVIII | 6.8 |
| 131 Å | Fields of flares | Fe VIII, XX, XXIII | 5.6, 7.0, 7.2 |
VIDEOS


ARTICLES


NEWS