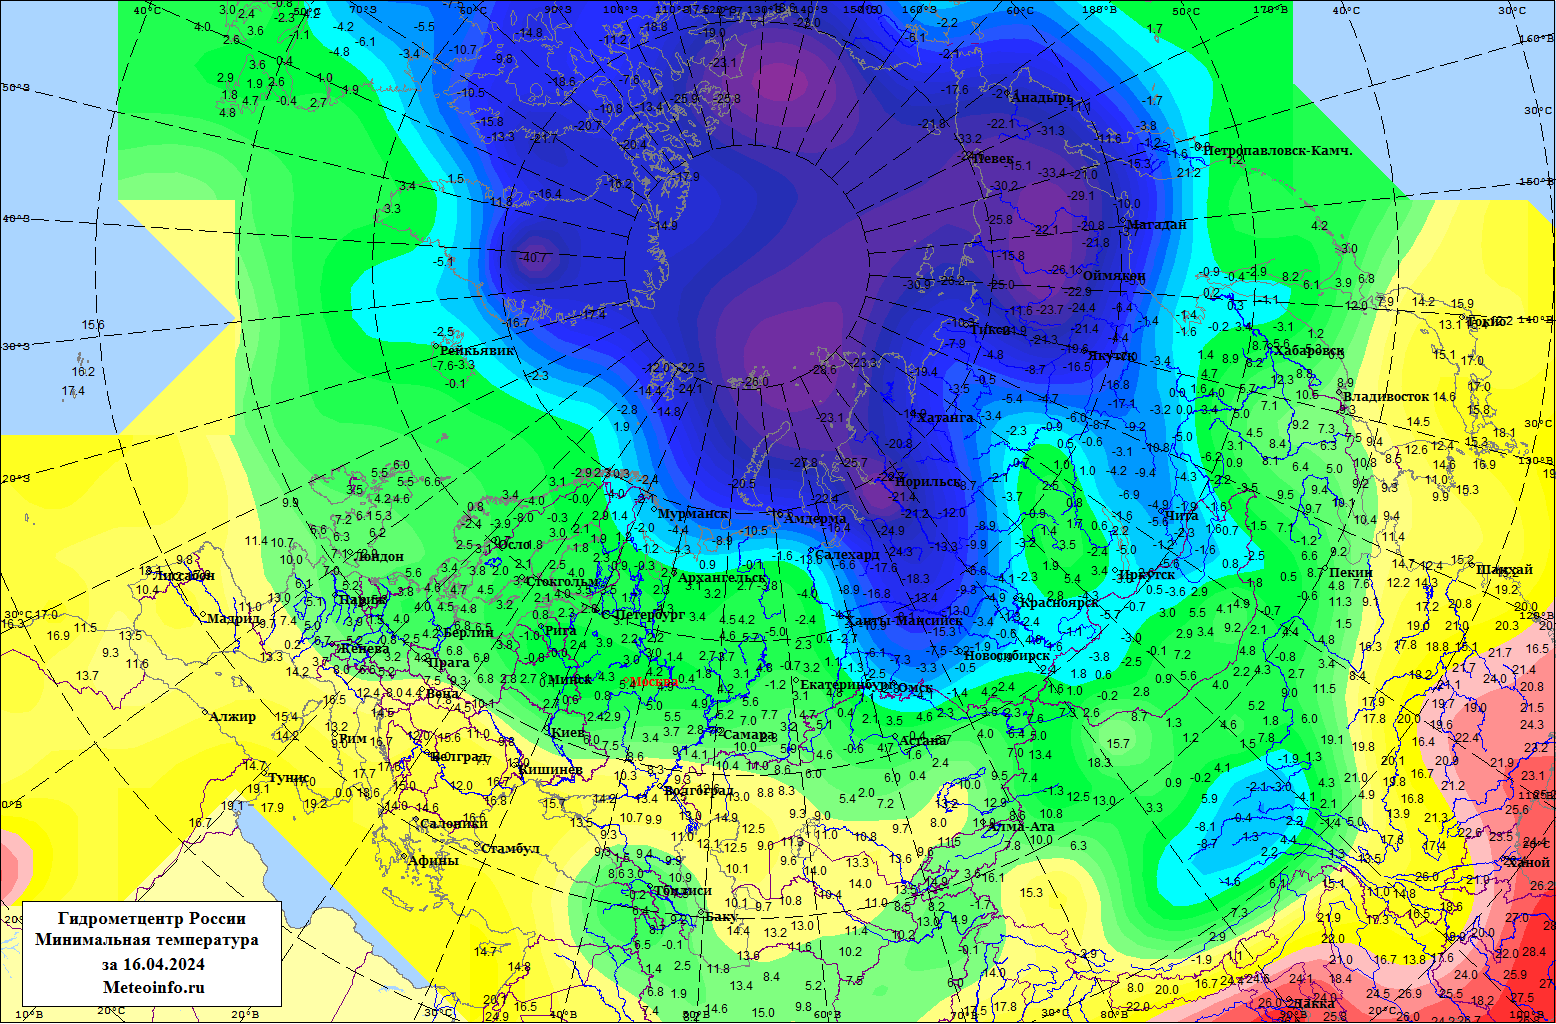
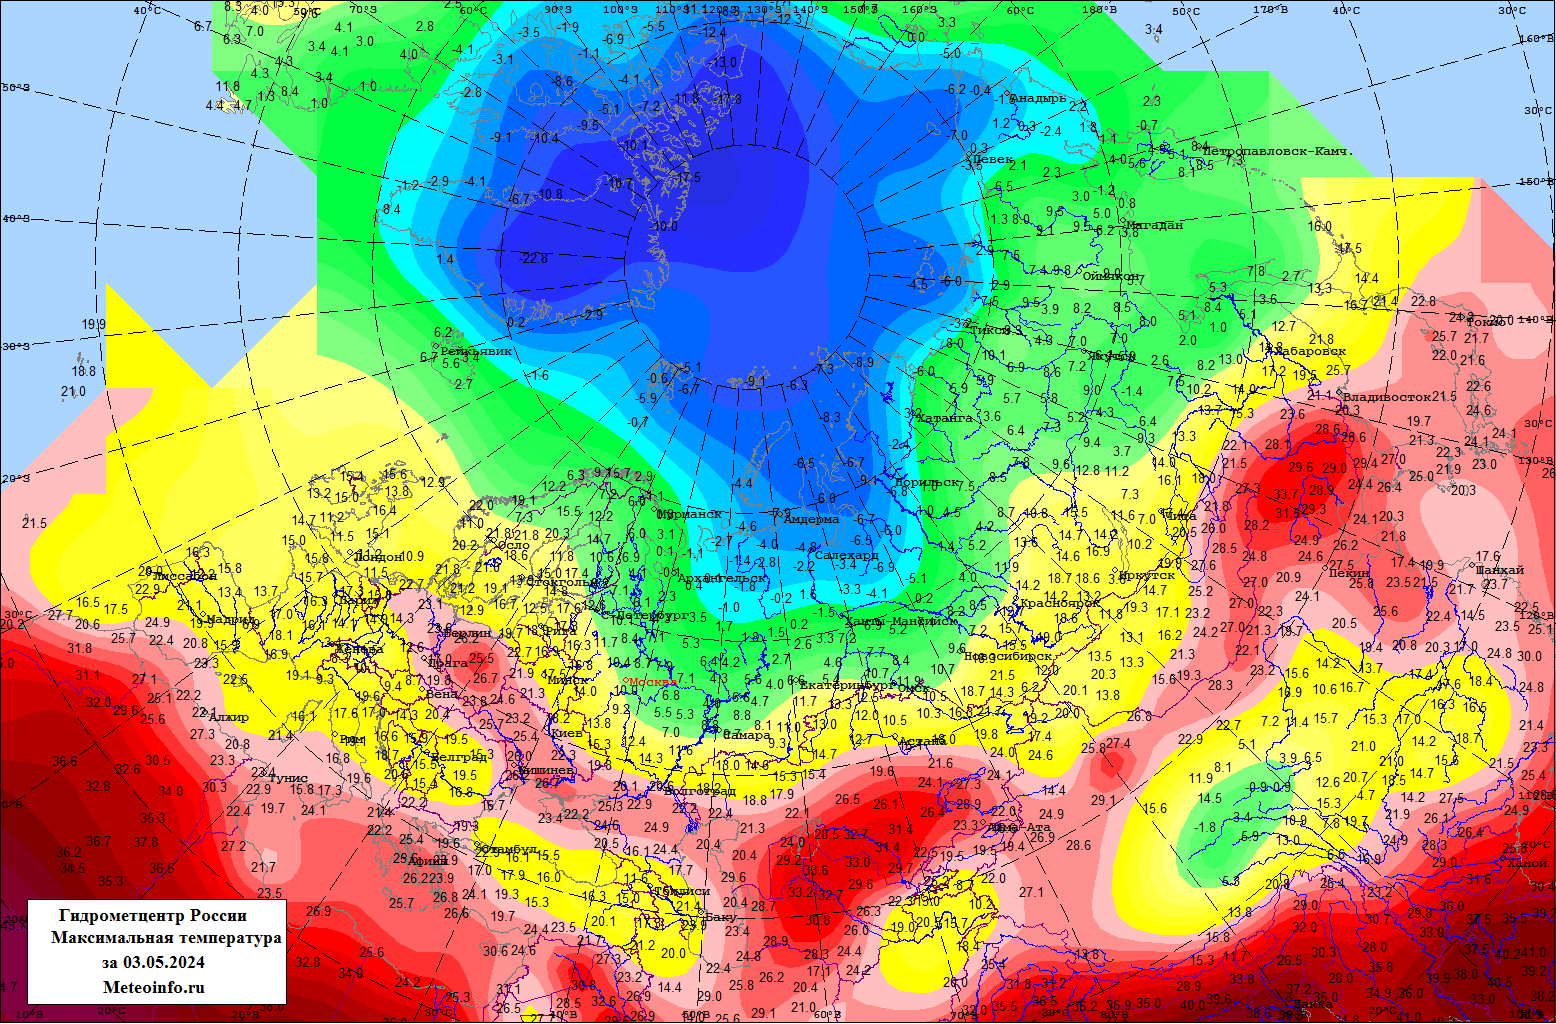
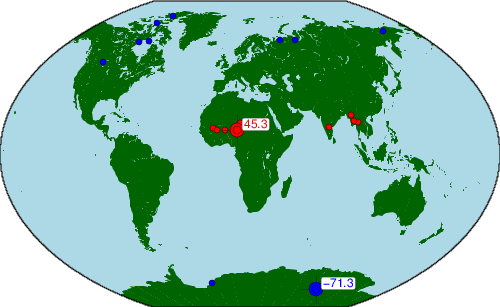
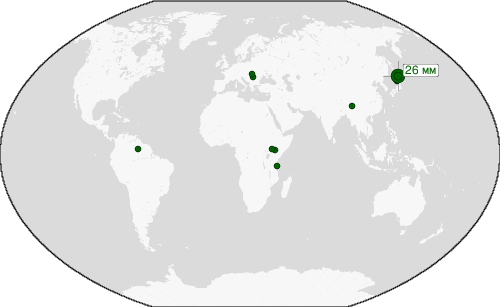
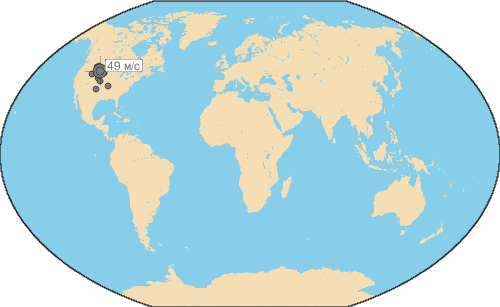
Meteorological extremums for the past 24 hours
VIDEOS

Jun 23, 2024, Breaking news 0


Jun 4, 2024, Breaking news 0

May 31, 2024, Analytical Reviews 0


May 25, 2024, Breaking news 0

May 23, 2024, Breaking news 0

May 17, 2024, Breaking news 0

May 16, 2024, Analytical Reviews 0

May 5, 2024, Breaking news 0
Apr 28, 2024, Breaking news 0

Apr 27, 2024, What does science say? 0


Apr 21, 2024, Breaking news 0
Apr 14, 2024, Breaking news 0

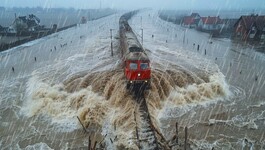
Weekly Report on Natural Disasters #5. Earthquake in Taiwan, Flood in Saudi Arabia, Storms in the US
Apr 7, 2024, Breaking news 0

Weekly Report on Natural Disasters #4. Earthquake in Indonesia, Snowfall in Europe, Floods in Brazil
Mar 31, 2024, Breaking news 0

Mar 24, 2024, Breaking news 0


ARTICLES
Oct 31, 2017, Climate Change, Analytics 0
Sep 10, 2017, Climate Change, Analytics 1

Sep 9, 2017, Climate Change, Analytics 0

Jun 24, 2017, Climate Change, Analytics 0

May 26, 2017, Climate Change, Analytics 0

May 6, 2017, Climate Change, Analytics 0

Dec 30, 2016, Climate Change, Analytics 0


NEWS

Aug 12, 2019, Climate through the Witnesses’ Eyes 0

Aug 3, 2019, Climate through the Witnesses’ Eyes 0
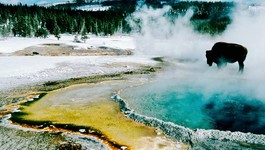
Apr 9, 2018, Volcanic Eruptions 0

Jan 5, 2018, Hurricanes, cyclones, typhoons, storms 0
Dec 28, 2017, Hurricanes, cyclones, typhoons, storms 0

Dec 21, 2017, Atmospheric phenomena 0


Sep 23, 2017, Earthquakes 0
Sep 23, 2017, Earthquakes 0

Sep 17, 2017, Landslides, collapses and snow-slips 0
Sep 17, 2017, Hurricanes, cyclones, typhoons, storms 0

Sep 11, 2017, Space phenomena 0